
By: Jerome Auza
I cringe every time I see a chart on my Facebook wall showing economy indicators “improving” during the Pres. Benigno Aquino administration. The way most of these charts are shown do indicate that a lot has improved in this administration, which is true, by the way. The problem is that these charts are not showing a complete picture and oftentimes fail to show the achievements by the previous administration.
You see, I deal with charts and charts data every day of my professional life. And with the computerized tools currently available for anyone to generate charts and publish them, it is easy to intentionally or unintentionally mislead the readers by showing a chart to highlight an improvement.
So I raise an eyebrow if I see telltale signs that a chart can be misleading. For example, someone declared that “Unemployment, went down consistently. From 7.3% in GMA’s administration, to 5.8% now.” Then the graph in Figure 1 is shown:
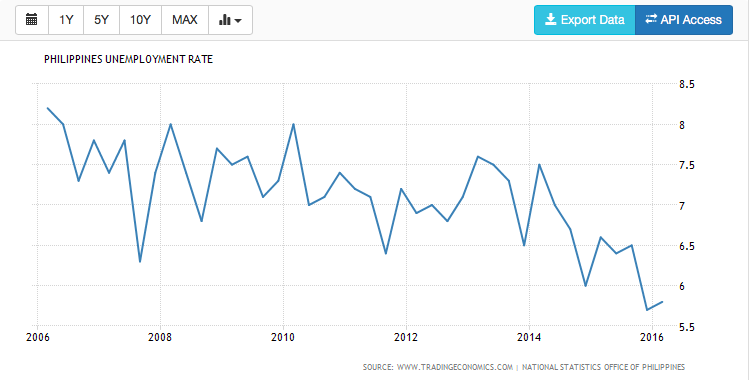
Figure 1. PH Unemployment rate from 2006 to 2016. Source: Tradingeconomics.com, Bureau of the Treasury, Philippines
What’s wrong with this chart is that the percentage numbers shown do not start from zero and thus you see a zoomed in line which shows a downward trend. It shows that the unemployment rate improved in 2010, when Aquino became president. But what if we look at all the data from further back? In Figure 2, we see a longer trend from 1996.
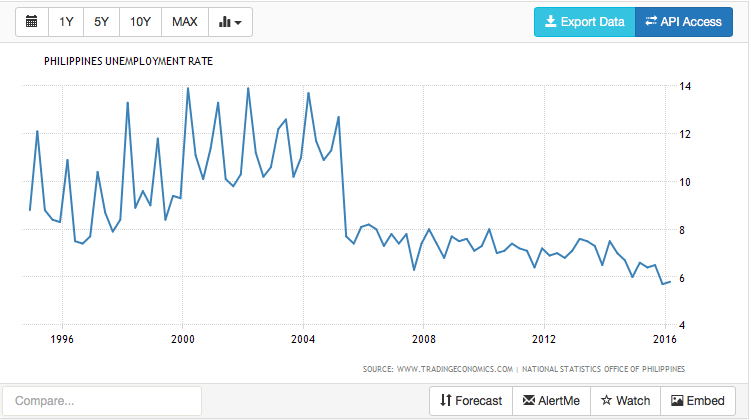
PH Unemployment rate from 1996 to 2016. Source: Tradingeconomics.com, Bureau of the Treasury, Philippines
The biggest drop in unemployment rate happened in 2005. Is this because of GMA’s achievement in generating jobs at that time? It’s hard to say because the unemployment definition was changed at that time. The old definition of unemployed considered only two criteria:
1) Without work and looking for work; or
2) Without work and not looking for work due to valid reasons.
And the current definition consists of persons in the labor force who are reported as (1) without work; and (2) currently available for work; and (3) seeking work or not seeking work because of the belief that no work is available, or awaiting results of previous job application, or because of temporary illness or disability, bad weather or waiting for rehire or job recall. The new definition of unemployed was adopted starting April 2005 per NSCB Resolution No. 15 dated October 20, 2004
One thing is clear though: that from 2005, the unemployment rate is trending down already and towards 2016, it seems to go downward faster. Perhaps if the 2008 worldwide financial crisis didn’t happen, we could have even better unemployment numbers.
So in short, the unemployment number was trending down already prior to 2010 and the Aquino administration maintained the downward trend and possibly increased the downward rate towards 2016. So it is right that the unemployment numbers improved in Aquino’s administration. It should also worth mentioning that the improvement started in GMA’s administration.
We see similar thing happening for GDP. Figure 3 shows the GDP from 2006 while Figure 4 shows GDB from 1960. The GDP rise started in 2002, went down a bit in 2010 and continued the trend upwards after that. If you look only at Figure 3, you will conclude that Aquino did a very good job in improving the GDP. However, if you look at Figure 4, the trend started in GMA’s time and it just simply continued the trend. Also, it seems that in 2014, the trend upwards may have started to slow down. We will know for sure after the 2015 data will be available.
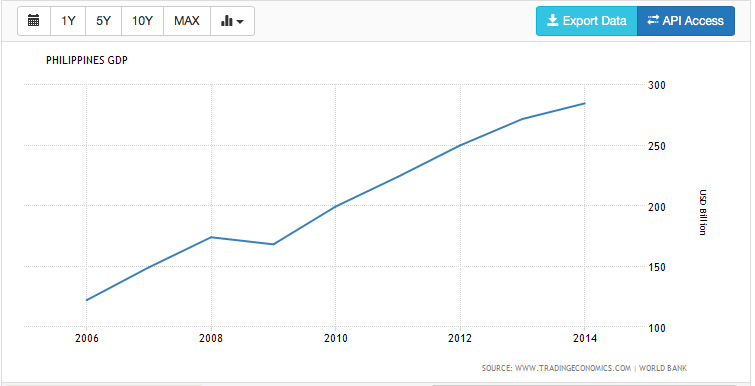
Figure 3. PH GDP from 1996 to 2014. Source: Tradingeconomics.com, Bureau of the Treasury, Philippines
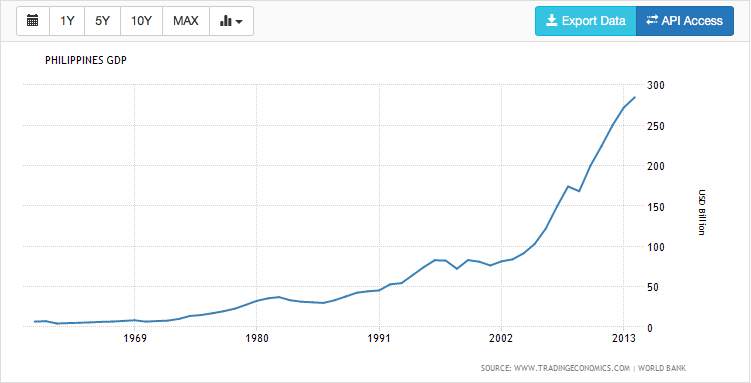
Figure 4. PH GDP from 1960 to 2014. Source: Tradingeconomics.com, Bureau of the Treasury, Philippines
And my last example is the PH Debt to GDP ratio. Figure 5 shows an apparently very significant improvement during Aquino’s administration, approximately 7 points improvement. However, Figure 6 shows that the biggest improvement in that ratio happened in GMA’s administration, around 20 points from the highest point until 2010 and the trend just continued in Aquino’s administration.
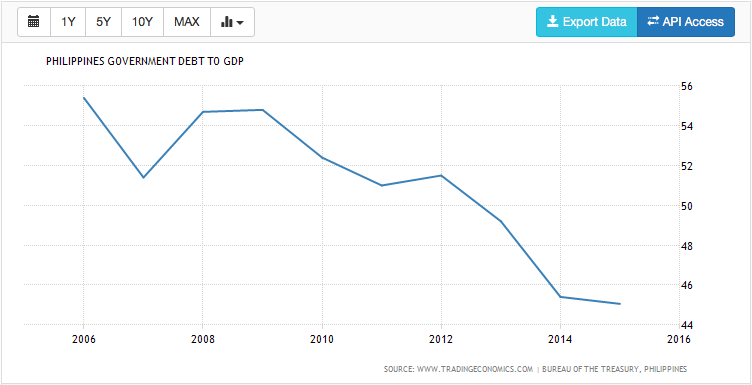
PH Debt to GDP Ration from 1996 to 2015. Source: Tradingeconomics.com, Bureau of the Treasury, Philippines
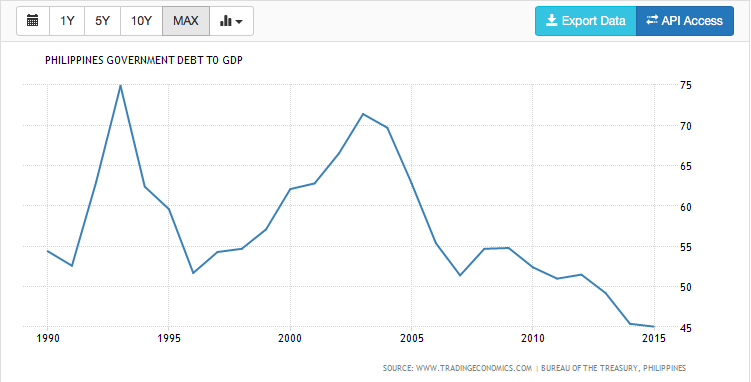
PH Debt to GDP Ration from 1990 to 2015. Source: Tradingeconomics.com, Bureau of the Treasury, Philippines
In summary, one should be careful not to be misled by a chart that do not show a complete picture. Charts are supposed to communicate a lot of information quickly but an incorrectly drawn chart could be misleading. In politics, it is common practice to tout an achievement by showing partial information on a chart. Watch out for zoomed in data as it would be difficult to assess the relative values on the timeline. This is especially true for long term trends like the economic indicators of the country.
In conclusion, it is very obvious that the significant improvements in the economic indicators started to improve significantly during GMA’s term and continued on by the Aquino administration. Both administrations should be commended for successfully improving our economy. Hopefully such trend will continue as the next president takes over later this year.